Your SIEM Is Up. Your Logs Aren't. Here's What Went Wrong.

Your SIEM solution is processing 20,000 events per second. The architecture says it can handle 30,000. The dashboards are green, the SOC is receiving alerts, and nothing looks wrong.
Then something changes.
A vulnerability scanner starts running across the network. A firewall suddenly becomes much more verbose. An application gets stuck in an error loop and starts generating thousands of events every second. In a few minutes, ingestion jumps from 20,000 EPS to 60,000.
The collectors are still receiving data, but the processing layer can't keep up. Queues start growing, CPU climbs, storage latency increases, and events begin arriving later than they should. Then some disappear.
The SIEM is still online. But your visibility isn't.
That's one of the more dangerous problems in SIEM engineering. A platform can be available while the telemetry feeding it is incomplete, delayed, or silently failing.
So the real question isn't: "Is the SIEM up?"
It's: "What happens to the logs when one part of the pipeline can't keep up?"
A resilient SIEM isn't just about choosing a platform with enough ingestion capacity. It means understanding what happens at every stage of the pipeline—from collection and processing to buffering, storage, and long-term retention—and knowing how each layer behaves when the workload changes.
A SIEM solution Isn't a Box
It's easy to think of a SIEM solution like this:

Production environments aren't that simple. A typical security telemetry pipeline looks more like this:
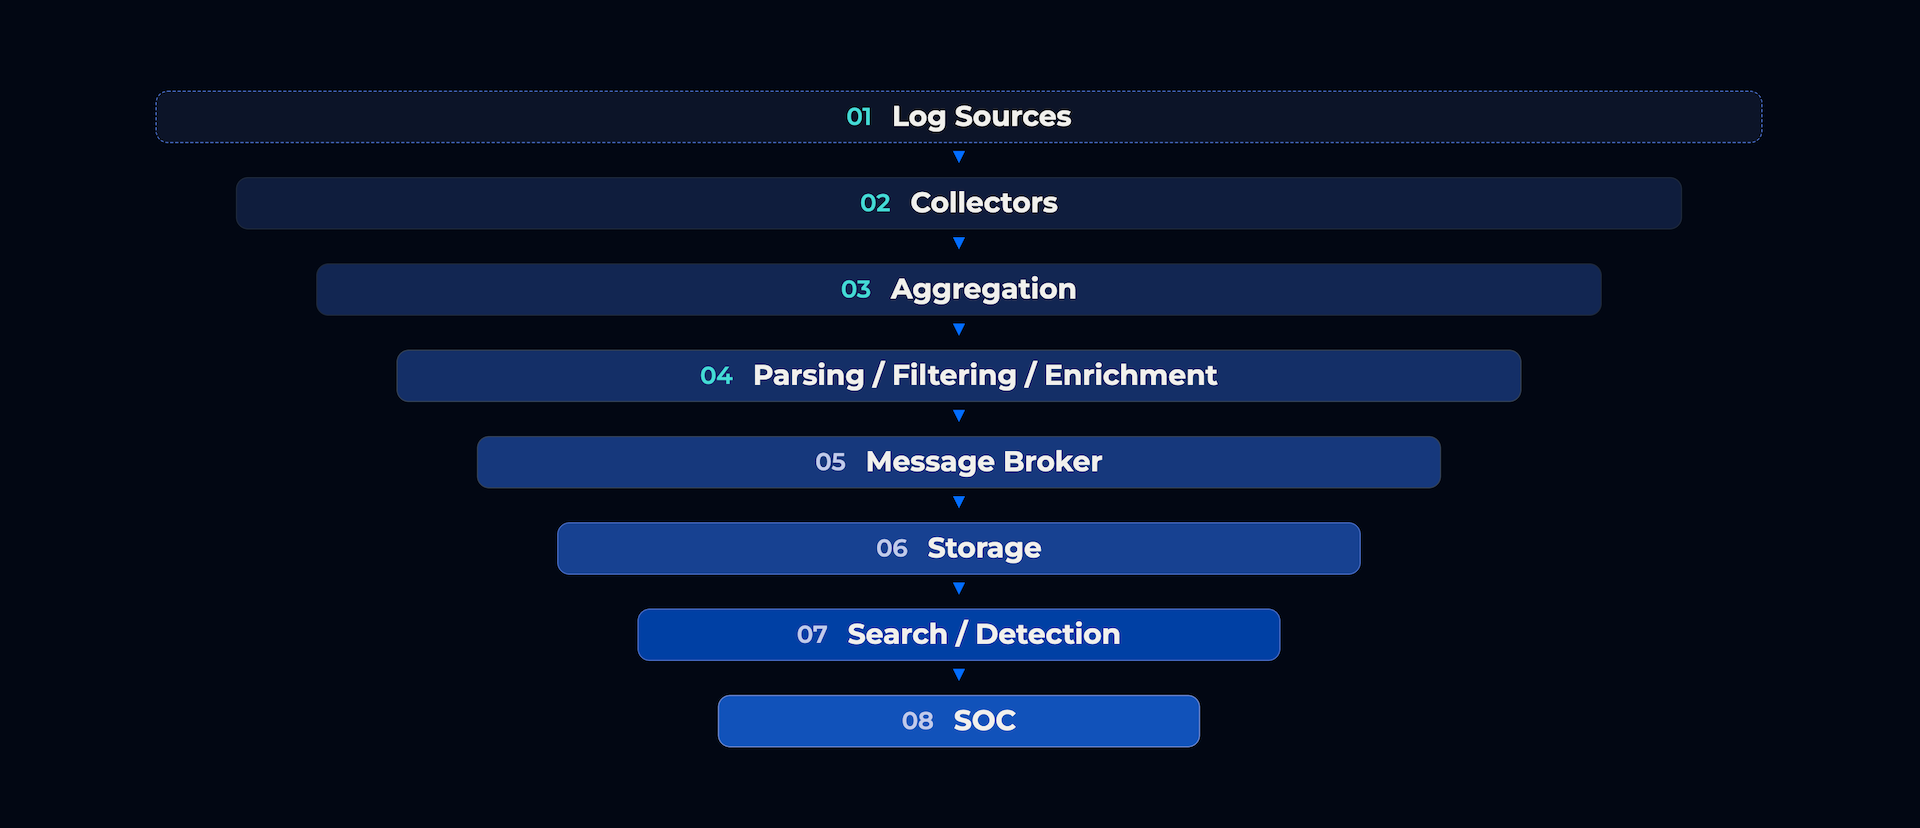
Every layer has a job. Collectors receive and transport events. The processing or aggregation layer can parse, normalize, filter, enrich, and route them. A message broker can sit between producers and consumers, giving the pipeline some breathing room when processing falls behind. Storage, search, detection, and alerting then turn that data into something the SOC can act on.
The important part is that these components aren't independent. If storage slows down, processing can back up. If processing backs up, queues grow. If the queues eventually fill, pressure moves toward the collectors and, depending on how the source behaves, events can be dropped.
That's a pipeline failure, not just a "SIEM problem."
EPS Isn't a Capacity Plan
EPS is probably the first number people ask about when sizing a SIEM solution. How many events per second? Fair question. But average EPS can be misleading.
Consider this environment:
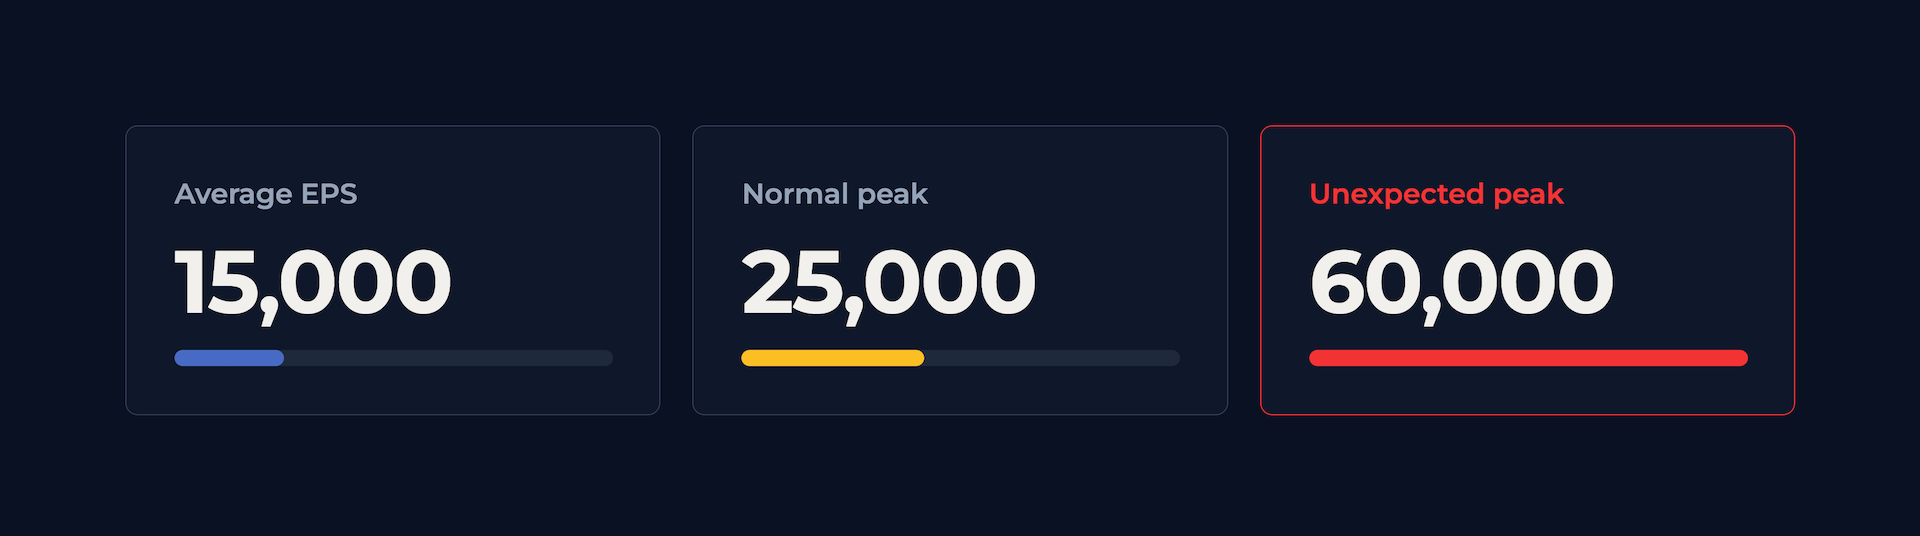
If you've designed everything around 15,000 EPS, you're already operating with very little room. Even 25,000 EPS might not be enough.
Security logs don't arrive at a perfectly consistent rate. They come in bursts. A vulnerability scan can generate a sudden increase in network events. An authentication problem can create thousands of repeated login attempts. A firewall configuration change can dramatically increase the amount of telemetry being generated.
Security experts highlight the importance of accounting for peak ingestion and future growth rather than designing around average EPS alone. A simple planning model is:
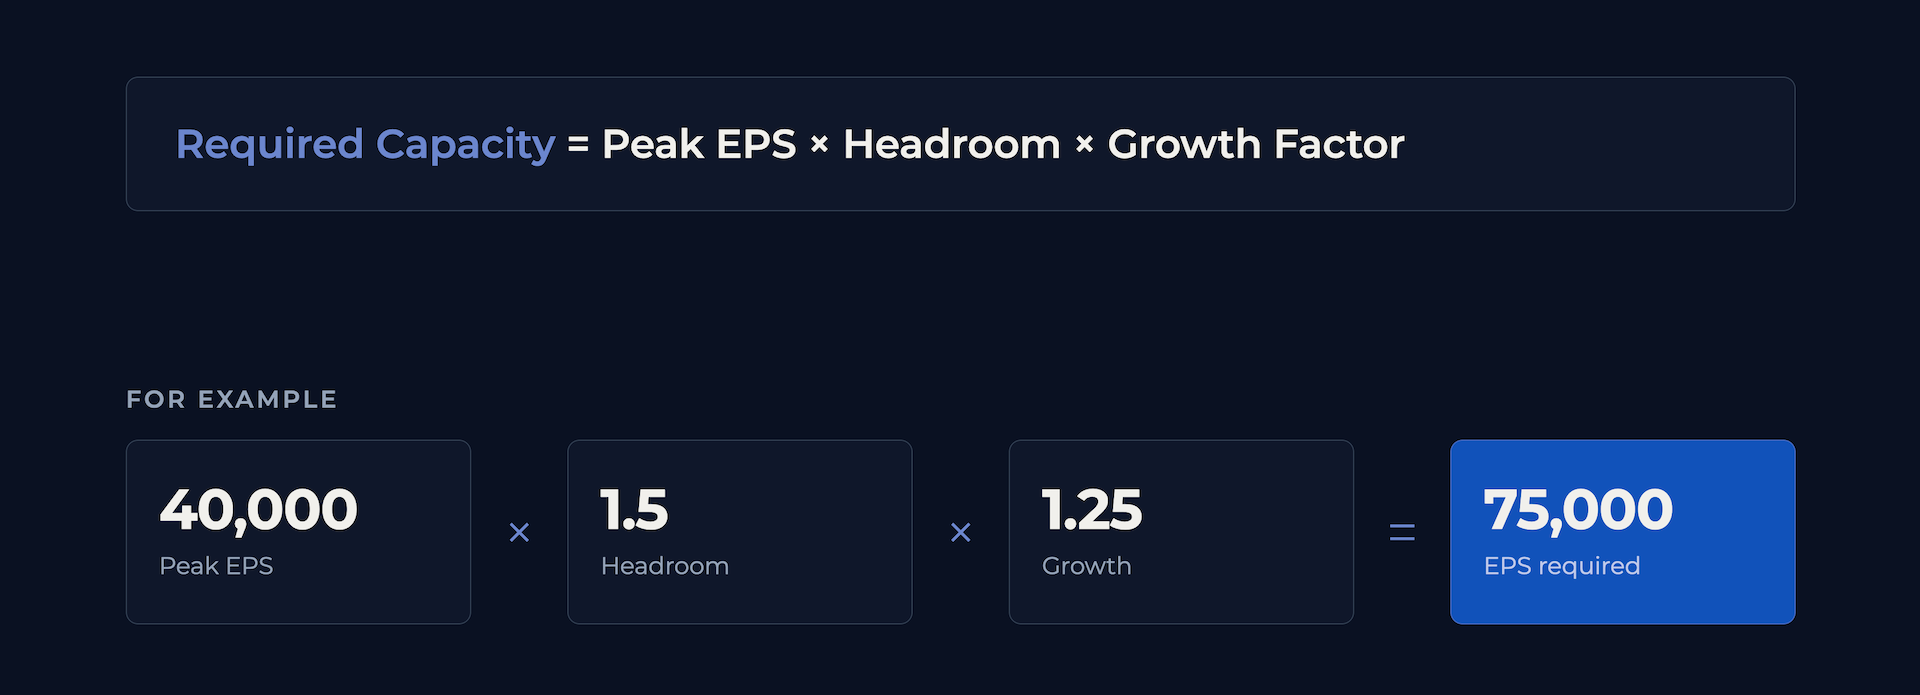
This is a planning estimate, not a universal sizing formula. Actual capacity depends on the event workload, processing requirements, architecture, and downstream systems.
It also doesn't mean you need one server capable of processing 75,000 EPS. It means your architecture needs enough aggregate capacity and resilience to deal with that workload without falling over.
Raw EPS Isn't Processed EPS
Here's where things get interesting. A processing layer might be able to receive 50,000 raw events per second. That doesn't mean it can parse, enrich, filter, normalize, and forward 50,000 events per second.
The processing path might look like this:
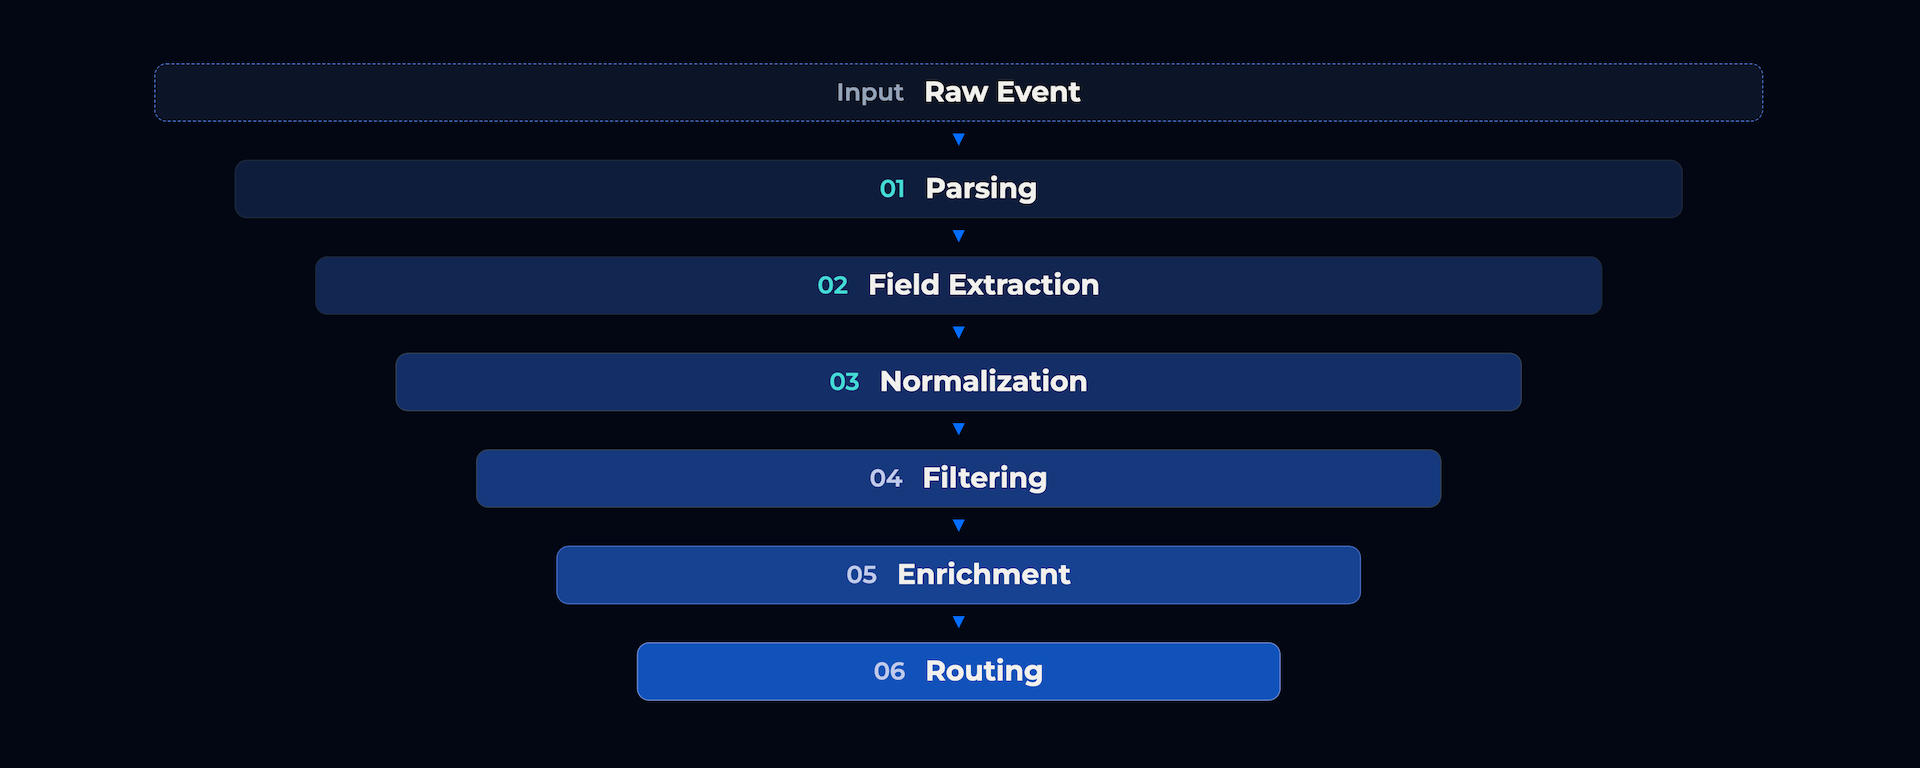
Every step costs something: CPU, memory, network bandwidth, and sometimes disk I/O. Parsing and enrichment can substantially reduce processing throughput.
Imagine two tests:
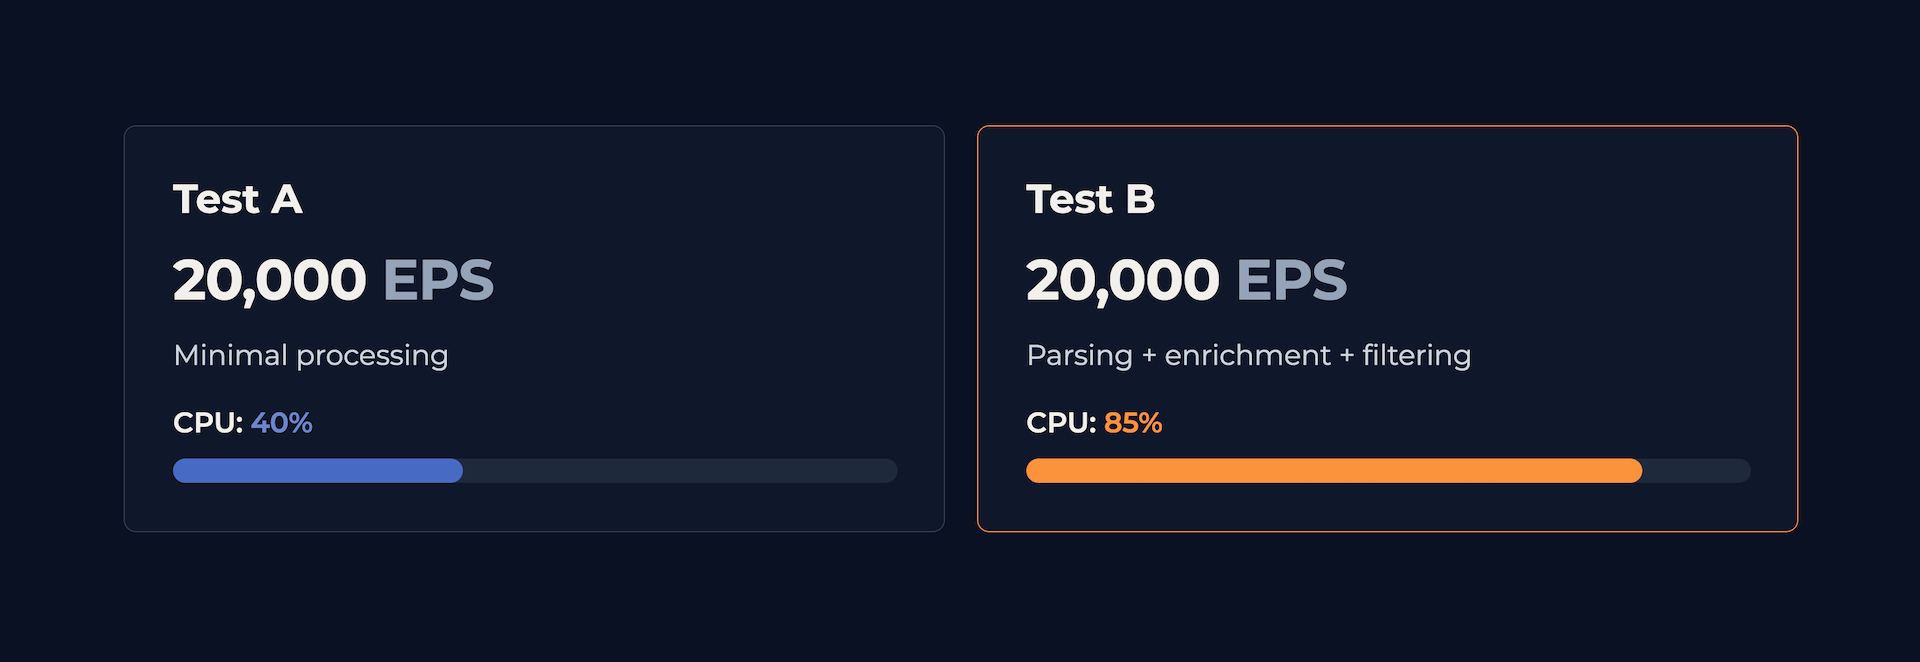
Same EPS. Completely different workload.
This is why a SIEM performance test shouldn't stop at "the collector can receive 50,000 EPS." You need to test the processing path you'll actually run in production. Otherwise, you're measuring the wrong thing.
Parsing Is Part of Security
Parsing often gets treated like configuration work. It shouldn't.
Take a firewall event:
ALLOW src=10.10.20.15
dst=172.16.10.20
sport=49122 dport=443
proto=tcp
A detection engine needs structured fields:
action   = ALLOW
src_ip   = 10.10.20.15
dst_ip   = 172.16.10.20
src_port = 49122
dst_port = 443
protocol = tcp
Now you can build useful detections around those fields. But what happens when the parser breaks?
The event might still arrive. The dashboard might still show it. The SIEM solution might look completely healthy. Yet src_ip could be missing, and a detection that depends on that field might quietly stop matching.
That's a nasty failure because nobody necessarily gets an obvious error.
The data is there. The useful data isn't.
So SIEM monitoring needs to cover data quality too:
- Parsing failures
- Missing fields
- Malformed events
- Timestamp problems
- Schema changes
- Source-specific ingestion gaps
Infrastructure health alone isn't enough.
The Message Broker: Buffer, Not Magic
Now let's say you're receiving 60,000 EPS but your processing layer can only handle 30,000.
Without buffering, you've got a problem. With a message broker, the architecture becomes:
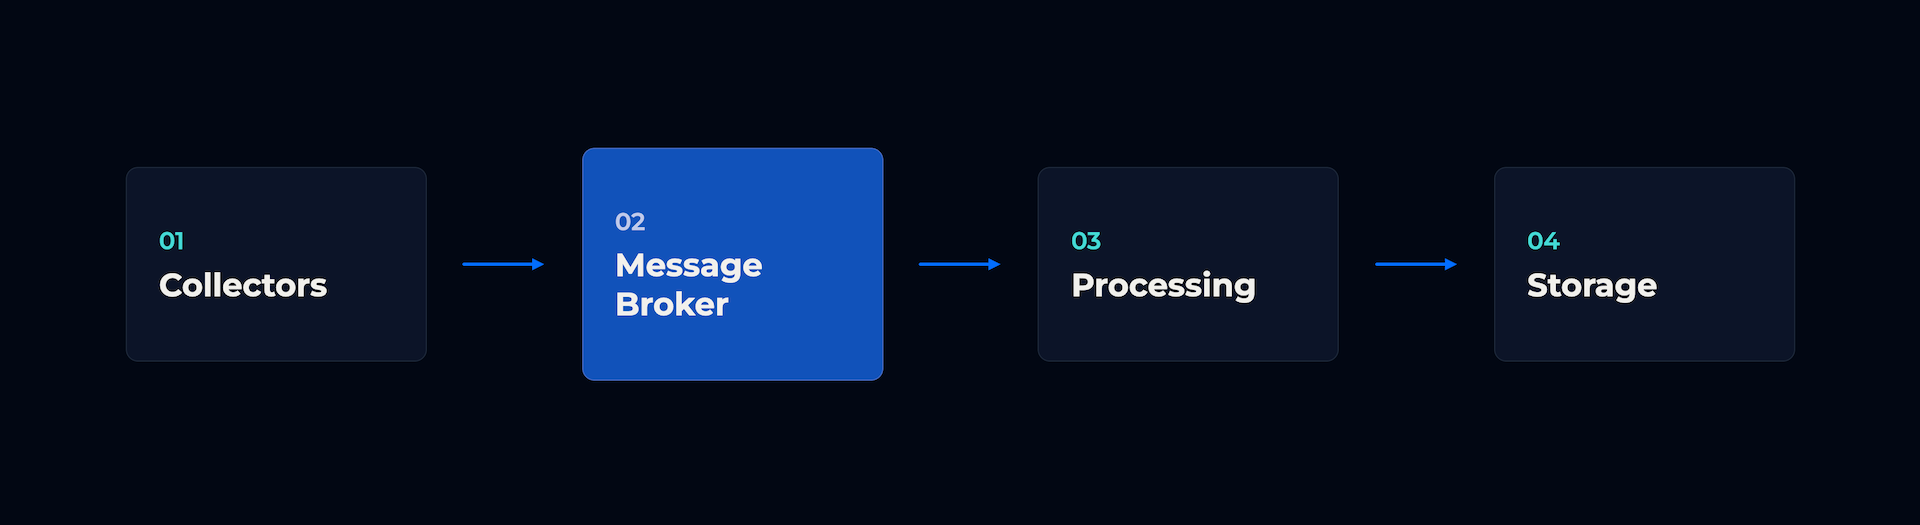
The broker separates the producer from the consumer. That matters because the collector can keep accepting events while the processing layer catches up, at least for a while. Some security experts SEC555 describe buffering and backpressure capability as a key reason to introduce a broker into a SIEM architecture.
But don't mistake buffering for extra processing capacity.
If this continues:
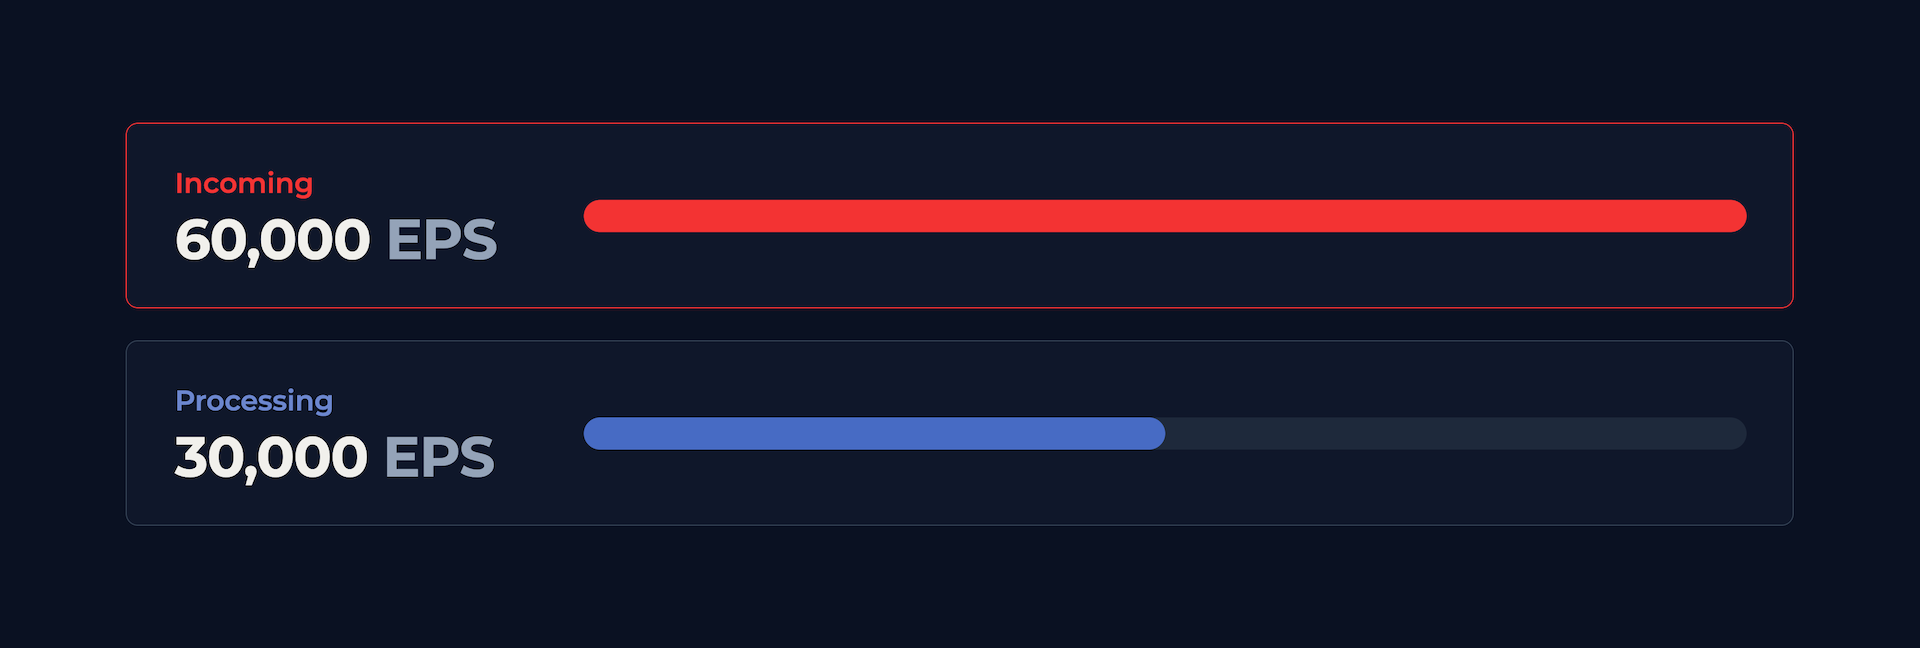
the queue will keep growing until it eventually fills.
That's why I'd monitor more than broker availability. Look at queue depth, consumer lag, message age, retry rates, dropped messages, and broker storage.
A queue that keeps getting bigger is already telling you something. The outage just hasn't happened yet.
Where Does the Data Lake Fit?
Not every security event needs to stay in expensive, highly searchable SIEM storage forever. A security data lake can provide a broader repository for long-term telemetry, threat hunting, forensic investigations, historical analysis, and large-scale analytics.
The SIEM and data lake don't have to do the same job. The SIEM solution is generally focused on operational detection, correlation, alerting, and investigation. The data lake can hold a much broader historical dataset and give security teams somewhere to go when an investigation goes beyond the SIEM's hot data.
Think about an account compromise. The SIEM might give an analyst the last 30 days of authentication activity. But what if the attacker was quietly using that account six months ago?
A data lake containing historical identity, DNS, firewall, endpoint, cloud, and application telemetry could provide a much larger window for investigation.
That's where the data lake becomes more than a storage tier. It becomes a source of historical security evidence.
Don't Turn the Data Lake Into a Data Dump
There's a trap here too. "Store everything" sounds great until you actually have to operate it.
A useful security data lake still needs thoughtful schema design, retention and lifecycle policies, access controls, governance, ingestion monitoring, and cost management. Five years of logs aren't very useful if nobody can efficiently search them.
You also need consistency. Fields such as timestamp, username, hostname, src_ip, dst_ip, and event_type need to remain useful across different sources if you want meaningful historical analysis.
More data doesn't automatically mean more visibility.
The data has to be usable.
SIEM + Data Lake
A more mature architecture might look like this:
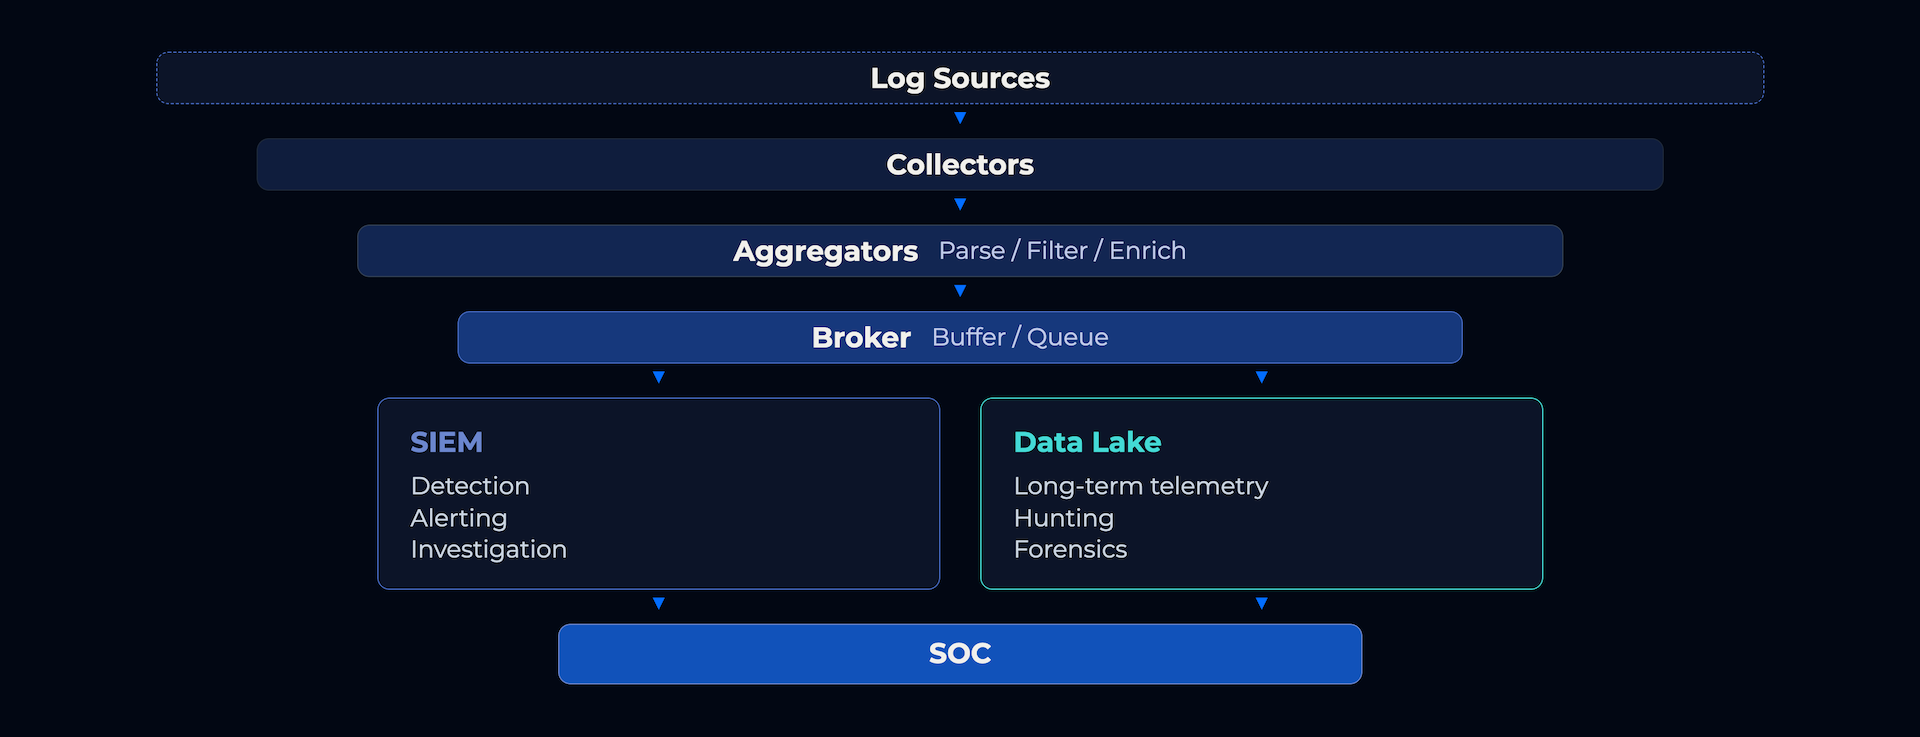
This approach gives you options. High-value, detection-focused data can remain in the SIEM for fast searches and correlation, while broader telemetry can be retained in the data lake for longer-term analysis. The broker can also provide a common distribution point between the collection layer and multiple downstream consumers.
That makes the architecture more flexible, but it also means you've got more components to operate and monitor.
There's no free complexity.
Design for Failure
A resilient SIEM solution shouldn't be tested only when everything is working. Test what happens when things fail.
Break it.
Ask what happens when an aggregator disappears. Can another processing node take over? What happens when storage becomes unavailable? Can upstream components buffer events? How much data can the broker hold? What happens when EPS suddenly triples?
What happens when a vendor changes its log format and your parser stops extracting fields?
And here's an important one: What happens when the SIEM itself is unavailable?
If your data lake continues receiving telemetry, you may still have the raw material needed for later investigation. That's one reason separating collection, processing, operational detection, and long-term retention can make the overall architecture more resilient.
Monitor the Pipeline, Not Just the SIEM
A SOC dashboard might focus on:
- Critical Alerts
- Incidents
- Suspicious Users
- Malware
- Lateral Movement
A SIEM engineer needs a different view:
- Ingestion EPS
- Processing EPS
- Queue Depth
- Consumer Lag
- Parsing Errors
- Dropped Events
- Source Health
- Storage Latency
- Indexing Rate
- Search Latency
- Ingestion Delay
- Data-Lake Ingestion
A SOC dashboard tells you what the security team can see. A pipeline dashboard tells you whether that visibility can be trusted.
You should be able to answer a few basic questions quickly:
- How many events did we expect?
- How many did we receive?
- How many were successfully processed?
- How many were indexed?
- How many were dropped?
- How old is the oldest event waiting in the pipeline?
Once you can answer those questions, SIEM reliability stops being a feeling. You can actually measure it.
The Real SIEM Engineering Problem
SIEM engineering is often described as:
Install the platform. Onboard the logs. Write detection rules.
That's only the beginning.
A production SIEM is a distributed data pipeline with producers, consumers, processing stages, queues, storage systems, workloads, and failure boundaries. The data lake adds another dimension: where should security telemetry live, and for how long?
The right answer depends on the use case. Recent, high-value data may need fast SIEM search and detection. Broader historical telemetry may belong in a data lake. Some data may eventually move to archival storage.
The important thing is to design those decisions deliberately.
Final Thoughts
A resilient SIEM isn't one that never fails. That's unrealistic. It's one where failure is visible, contained, measurable, and recoverable.
When ingestion spikes, you should know how much headroom you have. When processing falls behind, you should see the queue growing. When parsing breaks, you should know which sources are affected. When storage slows down, you should understand how much buffering remains. And when the SIEM isn't the right place to keep every event forever, the data lake should give you another option.
Because the most dangerous SIEM failure isn't always the one where the dashboard goes dark.
It's the one where everything looks normal—while the logs needed to detect the attack are delayed, malformed, stuck in a queue, or never arrive at all.
Your SIEM doesn't just need to detect attacks.
It needs to reliably preserve the evidence required to detect them.
How COGNNA Approaches Security Operations
This is where the engineering principles above become operational.
At COGNNA, we treat security operations as more than keeping a SIEM online or forwarding alerts to a SOC. The goal is to maintain reliable visibility across the security environment—while continuously monitoring the data, detection, and response processes that depend on it.
COGNNA's Smart MDR combines security technology with 24/7 Guardian expert oversight to monitor, investigate, hunt, and respond across the customer's existing security environment. The focus is not simply whether the platform is running, but whether the security operation is seeing what it needs to see, investigating what matters, and responding when action is required.
Because a SIEM can be green while your security visibility isn't.